Google History lets you track and search your own browsing history as well as look at trends over time, on any browser with the Google Toolbar installed. (You can also do only searches without the toolbar, just signed into Google.) You can also get personalized search results based on what sites you’ve visited and what you’ve previously searched for. All of this requires that you in turn give Google access to where you’re going on the Web.
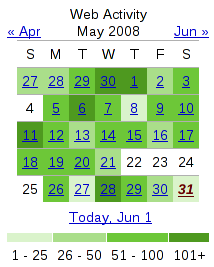
Since I signed up for the service a while ago, it’s certainly time to look at what I’m getting out of the deal. The easiest part to look at more quantitively is the trends. Here’s a calendar showing my search use over the month of May:

What can we learn from this? The most obvious response is that I do a lot of searches, around 50-100 on a typical day. You can also pretty clearly see any day I’m not online, such as the vacation I took from May 22-25. I use Google a lot more than I thought–I certainly didn’t realize I was searching for things 100 times a day or more.
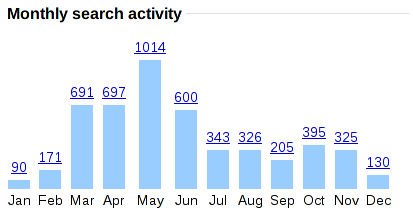
If we take a look at longer-term trends over the past year, things get pretty interesting:

Since June is where the wrap-around is from last year to this year, you might want to envision this chart instead starting at June and going to December, then January to May. My search use was pretty steady about a year ago, then it drastically dropped over the winter, then skyrocketed over the last few months. The winter drop correlates pretty well with final exams and a big push at work to get a paper written up and a grant submitted, both of which already had much of the online research done. I’m not sure how to explain the recent surge, though. I’ve been reading a lot more tech news, so it could be me looking up details about that. The same goes for interesting new software and websites I’ve looked into. I suspect the earlier 300-400 level is the most “normal,” so perhaps I’m just wasting more time over the past 3 months.
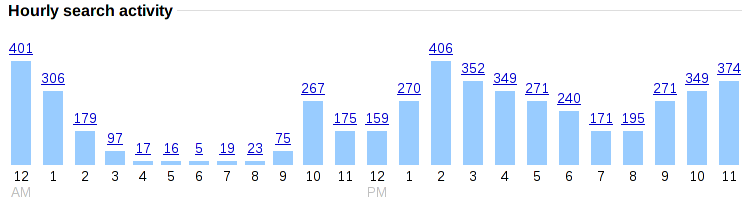
Another chart worth examining is the search activity by hour:

Looking at this and other data may make the monthly trends more clear too. I do the most searches shortly after getting to work, after lunch, and late at night, precisely the times I’m not getting as much work done. I would’ve guessed my most productive times at work are late morning before lunch and late afternoon, which seems to correlate well with the times with fewer searches. The nighttime increase is a whole different story, because that’s going to be work on Gentoo, which involves a lot more searching around the Web for solutions to problems.
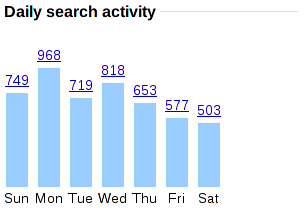
How about searches by day of the week?

If my conclusions from the hourly searches are accurate, I probably get the most done at work when I have the lowest search results, later in the week, and I’m guessing I generally don’t get as much done on Mondays. (Case of the Mondays, anyone?) The weekend drop is interesting too. Since I spend time working on Gentoo during weekends, I’m surprised the search total isn’t higher.
That’s about it for the trends. When looking at the websites I visited most often and terms I searched for most often, I knew they were actually fairly uncommon things. That indicated to me that I rarely search for the same thing or visit the same site over and over, so I’m not just using Google as an address bar for places I go often.
The main other thing that’s been useful for me is the ability to search my browsing history. Sometimes I remember the type of site I visited, but I don’t remember the name, and being able to search my history helps me find it. Usefully, Google also lets you sort results by date in case you can remember roughly when you were there.
Have you ever looked at your search or browsing trends? How did you do it? What did you conclude?